Bad data and mistakes has a real cost. Let’s speak about what is that and how hidden errors can impact your work. Every manufacturer faces that same frustrating moment — when the product’s real cost doesn’t match what’s in the spreadsheet. A missing supplier price, a duplicated component, or an incorrect quantity can ripple through the supply chain, causing procurement chaos, delayed orders, and margin erosion. The difference between an assumed $120 assembly and a real $180 one isn’t just accounting—it’s a visibility problem.
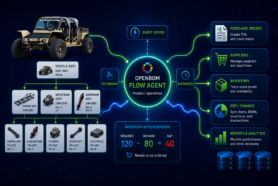
OpenBOM solves this by connecting all item, cost, and quantity data through a live, multi-level graph data model, enabling automatic cost roll-ups, real-time validation, and traceable visibility across every level of the product structure. The result is a connected digital representation of how your products are built — not as flat tables, but as intelligent, evolving networks of information.
The Challenge of Cost Visibility in Product Development
In many engineering and manufacturing organizations, cost visibility is fragmented. Teams rely on separate systems for CAD, PDM, ERP, and Excel spreadsheets — each telling only part of the story. When costs change, engineers might not know until it’s too late. When suppliers update prices, buyers may not see it until after the order.
Traditional PDM or PLM systems compound the problem. They rely on relational databases making it difficult to manage multi-level assemblies or to visualize how one change impacts the entire product structure.
This is where OpenBOM’s graph database architecture changes the game. OpenBOM represents products as interconnected graphs of relationships — items, assemblies, suppliers, revisions, and costs — all connected through links that preserve structure and meaning.
When data changes anywhere in the network, OpenBOM’s graph model ensures that every related assembly, cost roll-up, and report instantly reflects the update. The result is a living product structure, always synchronized and always accurate.
Flexible Cost Roll-Up Formulas: The Live Structure
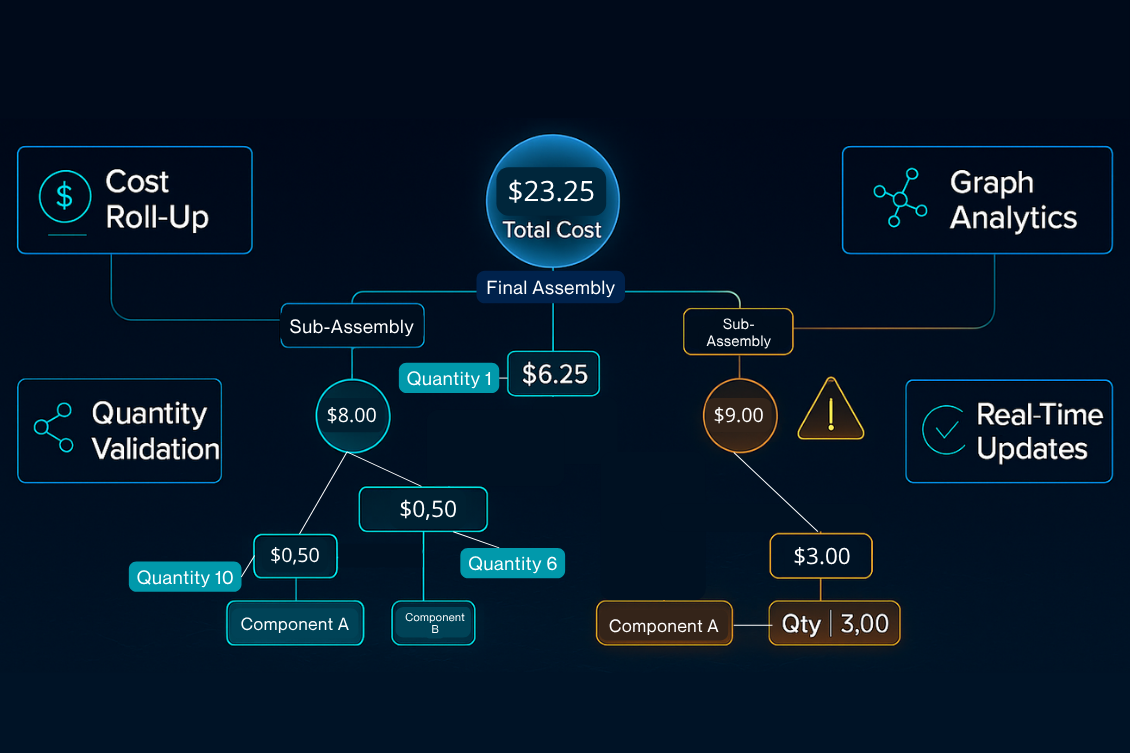
OpenBOM’s cost roll-up capability transforms cost calculation from a manual task into a live, automated process. Using its graph foundation, OpenBOM calculates total product costs at any level of the assembly in real time. Each node in the graph represents an item or subassembly, enriched with properties like unit cost, supplier, lead time, and procurement source.
When the system traverses the graph, it dynamically aggregates costs across all relationships — from the lowest-level component up to the top assembly. Nested subassemblies, vendor pricing, and manufacturing overhead all roll up automatically.
However, for users, it is presented in a much easier way:

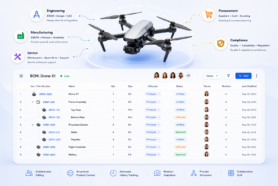
Because OpenBOM supports multi-view xBOM structures, users can view cost roll-ups from different perspectives — engineering, manufacturing, or procurement — without duplicating data or breaking traceability. Each view reads from the same graph, ensuring consistent, up-to-date results.
Example:
A supplier updates the cost of a fastener in the catalog. Instantly, OpenBOM propagates the new value through all connected assemblies, updating every relevant total.
No manual recalculations, no missed updates — just accurate, live cost data powered by the graph.
This capability turns cost visibility into a continuous feedback loop. Engineers see cost implications early. Buyers track supplier impact instantly. Managers make pricing and sourcing decisions based on real-time information.
Quantity Analysis & Validation Tools in Action
OpenBOM’s quantity analysis and validation tools extend the same graph-driven intelligence to detect inconsistencies and anomalies across complex product configurations. Unlike traditional systems that only compare static line items, OpenBOM’s graph traversal engine explores relationships dynamically — understanding that a change in one place might affect many downstream assemblies.
Because every node and relationship in OpenBOM’s graph carries rich metadata — such as cost, revision, supplier, and quantity — the platform can apply graph data science algorithms to analyze dependencies, detect outliers, and visualize validation results interactively.
These algorithms go beyond simple counting; they map entire dependency chains to identify where inconsistencies originate and how they propagate. For example:
- Detecting duplicate items across assemblies.
- Flagging mismatched revisions between engineering and manufacturing BOMs.
- Identifying loops or broken links that can create validation errors.
The result is a live validation dashboard where engineers see mismatches, dependencies, and anomalies in context — not just as error lists, but as visually mapped relationships. They can navigate through the product graph, isolate problems, and fix them with confidence.
This capability illustrates the power of graph analytics in product lifecycle management:
instead of static comparison, OpenBOM performs network reasoning — understanding the structure of relationships, not just their values.
Real Examples: Validation and Roll-Ups That Drive Decisions
These capabilities are not theoretical. OpenBOM customers use cost roll-ups and validation every day to gain visibility, optimize decisions, and reduce costly mistakes.
Fencequip – Solving the Real Cost Analysis Problem
FENCEQUIP manufactures advanced fence equipment and faced a challenge common to many small manufacturers — they lacked real-time visibility into material expenses. Engineers had limited insight into how design decisions impacted cost, and purchasing often discovered issues only after orders were placed.
Without connected cost data, inefficiencies accumulated — material over-purchasing, delays, and rework. Fencequip needed a system that could tie design and purchasing data together seamlessly.
With OpenBOM, Fencequip implemented lean manufacturing practices and used automated cost roll-ups to connect every design decision with its financial impact.
Engineers could instantly visualize cost changes as they modified assemblies, while buyers gained real-time visibility into material requirements.
OpenBOM’s graph-based BOM engine ensured that supplier cost changes were automatically reflected across related assemblies — eliminating guesswork and enabling proactive decision-making.
The result was a leaner, more agile process where cost accuracy became part of daily engineering work — not an afterthought during procurement.
CANMET Design – Real-Time Costing and Quote Generation
CANMET Design faced a similar challenge in managing complex data tied to their engineering and quoting process.
Their workflow involved not just CAD data but also labor costs, assembly steps, paint specifications, and supplier pricing — all tracked through disconnected spreadsheets and local databases. Each update required manual changes, introducing delay and errors that made real-time cost analysis nearly impossible.
By adopting OpenBOM for SolidWorks, CANMET unified their product and cost data within a single connected model.
OpenBOM’s graph database allowed them to model all relationships — between CAD components, labor steps, and materials — so that any change in design immediately recalculated total cost and impacted quote generation.
Now, when CanMet engineers update a model in SolidWorks, OpenBOM automatically recalculates roll-ups and syncs quantities and costs in real time. This eliminated manual reconciliation work and gave CanMet’s leadership an instant, accurate view of project profitability.
In their own words, “OpenBOM gave us real-time cost insights without disrupting our design workflow.”
Graph-Based Insight That Drives Decisions
Both Fencequip and CanMet illustrate a powerful truth: When product data is modeled as a graph, it becomes self-validating and self-correcting.
OpenBOM doesn’t just calculate totals — it understands relationships. Cost, quantity, and structure are part of a single connected data fabric that can be traversed, queried, and analyzed from any angle.
Graph analytics allows OpenBOM to uncover subtle patterns that traditional systems miss — like how a small supplier change cascades through multiple assemblies, or how a shared subcomponent affects cost across product families. This intelligence empowers teams to not just react to changes, but anticipate them.
The Future Bigger Picture: Graph Intelligence as the Foundation of the Digital Thread
Cost and quantity validation are more than operational tools — they are fundamental building blocks of a reliable digital thread. When engineering, procurement, and manufacturing data are connected through graph relationships, every part of the organization gains shared visibility into product truth.
OpenBOM’s graph database and graph data science foundation make this level of visibility possible at scale. It allows the system to:
- Identify inconsistencies, such as loops or missing connections in the product structure.
- Maintain version integrity between evolving design and production views.
- Deliver analytics-driven insights that link product performance to design decisions.
This approach represents a new kind of intelligence — graph intelligence — where data relationships become the source of truth, and where analysis happens in real time, across the full lifecycle of a product.
For SMBs and mid-size manufacturers, this means achieving what was once possible only in large enterprise PLM deployments: a continuously validated, cost-aware, connected digital thread.
Conclusion: From Data Accuracy to Competitive Advantage
In today’s fast-moving manufacturing environment, data accuracy is the new competitive edge. Companies that can see cost and quantity data in real time — and trust that information — operate faster, make better sourcing decisions, and deliver products with fewer surprises.
OpenBOM transforms disconnected spreadsheets into an intelligent, graph-powered data model — one that automatically links every cost, quantity, and relationship across the product lifecycle.
Its combination of graph database, xBOM multi-view architecture, and data science ensures that data doesn’t just sit in a repository — it works for you, continuously validating and updating itself.
REGISTER FOR FREE and discover how OpenBOM’s graph-powered validation tools can help you uncover hidden costs, correct quantity mismatches, and ensure data accuracy across your entire product lifecycle.
Best, Oleg
Join our newsletter to receive a weekly portion of news, articles, and tips about OpenBOM and our community.