If you work in engineering or manufacturing, you probably spend a lot of time trying to keep your data organized—BOMs, parts, revisions, files, vendors, and all the rest. You might use Excel, CAD systems, emails, ERP exports—maybe even all of the above. But here’s a question: how do you actually connect it all together so it makes sense?
That’s where knowledge graphs come in—and it turns out, they’re one of the strongest (and quietest) parts of OpenBOM.
What is a Knowledge Graph, Really?
A knowledge graph is a way of organizing information that focuses on relationships.
Think of it like this:
- A part is used in an assembly.
- An assembly is designed in a CAD file.
- A CAD file is linked to a revision.
- A purchase order sent to a vendor
- A revision belongs to a specific order
- A product revision used in a specific serial number (SN)
- A software version is installed for a customer using specific product configurations and SN
Each of these statements sounds simple—but taken together, they form a web of connected knowledge. That’s a knowledge graph.
You’ve already seen them in action, even if you didn’t realize it. For example:
- Google Search shows extra panels for people, companies, movies, and products—that’s powered by a knowledge graph.
- LinkedIn shows how you’re connected to someone, even if you’ve never met them—that’s a graph of people and their relationships.
- Spotify or Netflix recommends things based on what’s related—not just what’s popular. That’s a graph of user behavior, content, and connections.
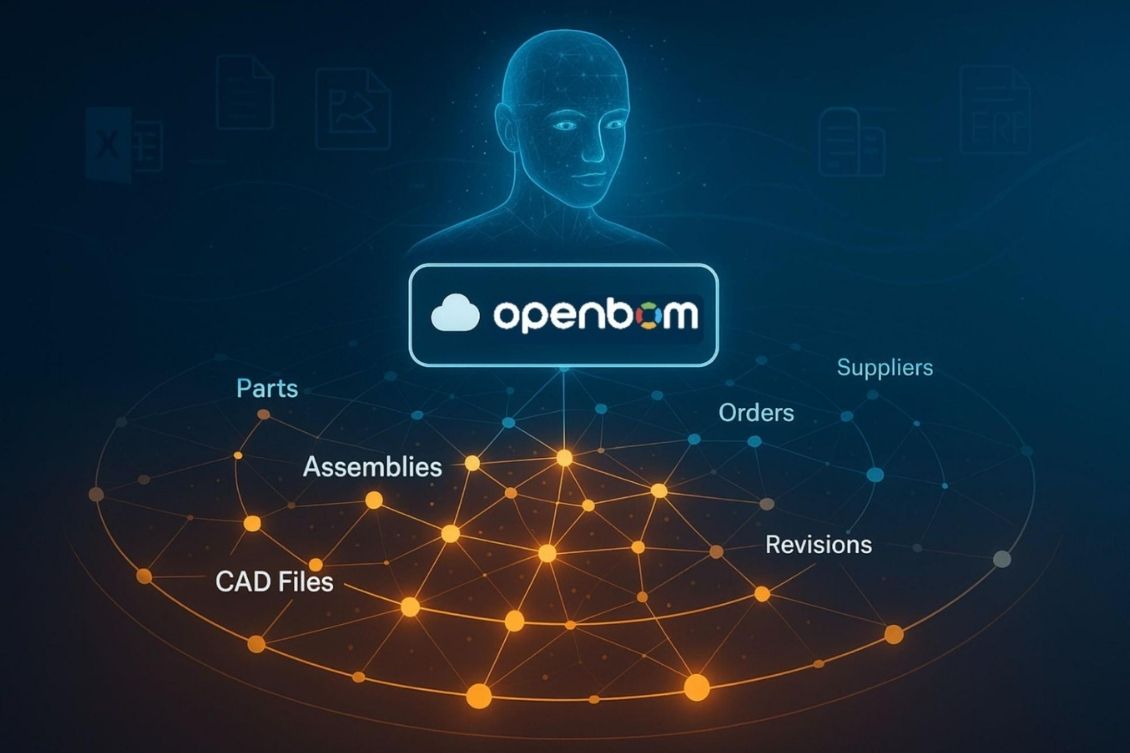
Now imagine applying this same idea to product development—that’s what OpenBOM does.
The State of Knowledge Graphs in 2025
According to the 2025 Gartner Hype Cycle for AI, knowledge graphs are now climbing the Slope of Enlightenment. That means we’ve passed the early hype, we’ve seen which use cases actually work, and we’re now in a phase where adoption is increasing because the value is clear.
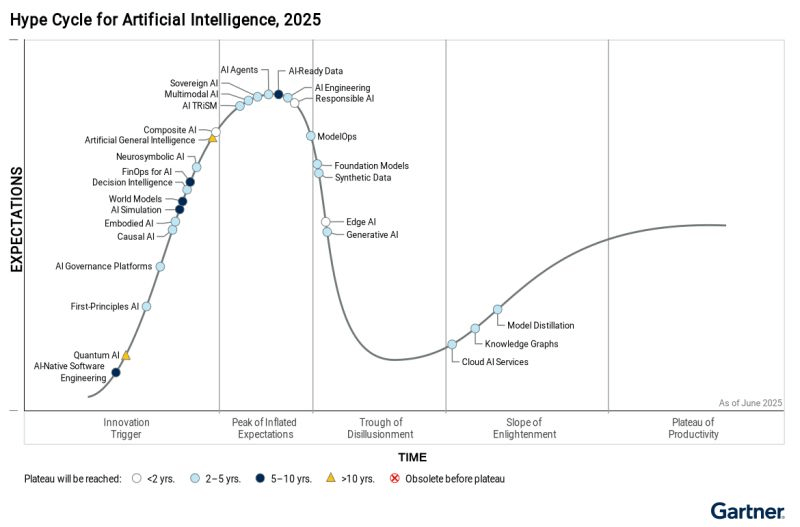
In other words: we’re not experimenting anymore—we’re using them to solve real problems.
For AI in particular, graphs are essential. AI needs structured, connected data to reason properly. Without it, you get messy answers or hallucinations. But with a graph, AI can follow paths, find links, and answer questions in context.
How OpenBOM Uses Knowledge Graphs (Without You Even Noticing)
OpenBOM was built on a knowledge graph from the start. But we never made a big deal out of it, because the goal wasn’t to talk about graphs—it was to help engineers and teams get their work done.
Still, here’s what’s happening behind the scenes.
- You upload an Excel file → OpenBOM turns it into structured items and links them into catalogs and BOMs.
- You connect your CAD → parts and assemblies flow in, automatically connected to their parent BOMs and metadata.
- You add vendor info, costs, or PO data → it’s all stitched into the same graph, connecting sourcing to design.
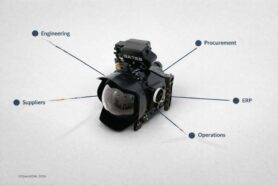
No extra work. But suddenly, your data is no longer scattered—it’s connected, like a digital nervous system for your product.
This graph grows over time. Each file, each revision, each order adds more connections. And because it’s a graph, OpenBOM can do things most systems can’t.
Why the Knowledge Graph Matters (Especially Now)
Let’s say you want to answer one of these questions:
- Where is this part used across all products?
- What’s the cost breakdown of everything we buy from Vendor X?
- What’s the most critical supplier?
- What parts are affected if I change this component?
- Which items share the same material or supplier?
- What orders include a specific revision of a component?
If your system is based on traditional data management technologies, you’ll need to do a lot of complex queries, filtering, maybe even some additional data processing to get results. Think of a query that returns all top-level products using specific components purchased from a specific vendor(s). It can be an easy IT task in a traditional PLM architecture.
But in OpenBOM? These are just graph queries. You’re not digging through data—you’re walking through a connected network. Using the OpenBOM knowledge graph is part of graph data queries (done using Cypher) or Graph Data Science Libraries.
Knowledge Graph + AI = OpenBOM Agent
This graph foundation is also what powers the new OpenBOM AI Agent.
AI is great at answering questions, but only if it has the right context. That’s what the knowledge graph provides.
When you ask the AI agent something like, “Show me all parts used in assemblies built for the European market using suppliers in China,” it doesn’t guess. It follows the links in your data—the same links OpenBOM has been building all along.
This is why we didn’t just bolt AI on top of OpenBOM. We built the foundation first. The AI sits on top of a structured knowledge graph, and that’s what makes it smart.
Final Thoughts: It’s Not Just About Buzzwords
We don’t expect most users to log in to OpenBOM and think, “Wow, this graph is amazing.” You shouldn’t have to. But it’s there, quietly doing its job, helping you make better decisions, faster.
Now that knowledge graphs are becoming more widely recognized (thanks to Gartner and growing AI adoption), we wanted to share how much this has always been part of what makes OpenBOM different.
So the next time you import a spreadsheet or generate a BOM in OpenBOM, remember: you’re not just making a list—you’re building a connected system of knowledge.
And that system is already powering the next generation of tools to help you design, plan, and manufacture better products.
Want to check how OpenBOM can help?
REGISTER FOR FREE and run a free 14-day trial.
Best, Oleg
Join our newsletter to receive a weekly portion of news, articles, and tips about OpenBOM and our community.