Graph databases are transforming how we manage and analyze complex data structures. With their ability to represent data as interconnected nodes and relationships, graphs are well-suited for tackling challenges in domains like product lifecycle management (PLM), supply chain optimization, and digital threads. Here is Gartner’s prediction about graph databases:
“By 2025, graph technologies will be used in 80% of data and analytics innovations, up from 10% in 2021, facilitating rapid decision-making across the enterprise,” predicts Gartner® in its Exploring the Top Use Cases for Graph Analytics report, May 10, 2024
This underscores the rising significance of graph-based solutions for delivering deeper insights and efficiency in modern industries.
OpenBOM has embraced this trend by integrating graph data modeling into its Product Knowledge Graph foundation. Check the article – Why OpenBOM is using graph databases This forward-thinking approach equips manufacturers and engineers with unparalleled tools for managing and analyzing product data.
Why OpenBOM Relies on Graph Databases
OpenBOM’s architecture is built on a combination of NoSQL databases and the Neo4j graph database. This hybrid approach allows OpenBOM to tackle both structured and highly interconnected data challenges. The graph database’s ability to navigate relationships with high efficiency makes it an ideal choice for operations like BOM traversal, “where-used” analysis, and multi-level dependencies.
For OpenBOM, the graph database is not just a tool but a strategic enabler, enhancing its platform’s capabilities to handle complex product data and drive innovation in analytics and connectivity.
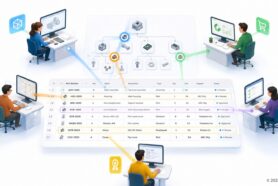
Example 1: “Where-Used” Graph Query
One of the standout features of OpenBOM is its “where-used” operation. This capability identifies all the top-level BOMs where a specific part or assembly is used. Leveraging the graph database, this query traverses relationships between components and assemblies with remarkable efficiency.
Unlike traditional PLM systems reliant on SQL databases, which struggle with deep and complex data hierarchies, OpenBOM’s graph-powered approach delivers lightning-fast query results, even for highly interconnected datasets.
See the video here demonstrating the operation in action, showcasing how OpenBOM outperforms legacy systems in speed and scalability.
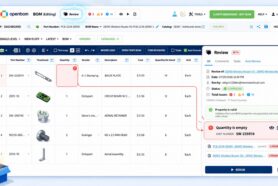
Example 2: Finding Not Used Items
Let’s take a deeper look at another example to illustrate the power of graph queries in OpenBOM. Using Neo4j’s Cypher query language, OpenBOM can identify all items in a product database that are not used in any BOMs. This insight is critical for improving data hygiene, reducing waste, and ensuring no important components are overlooked.
See the video here where we demonstrate how Neo4j CYPHER query runs efficiently, leveraging the graph model’s inherent strengths in relationship-based analysis.
What’s Coming: Graph-Based Analytics Dashboard
Looking ahead, OpenBOM is gearing up to introduce a robust analytics dashboard, powered by Neo4j Graph Data Science library.
Graph Data Science is an analytics and machine learning (ML) solution that analyzes relationships in data to improve predictions and discover insights. It plugs into data ecosystems so data science teams can get more projects into production and share business insights quickly.
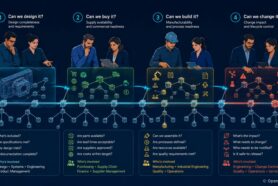
This upcoming feature will allow users to run dynamic reports and analytics, unlocking powerful capabilities to explore:
- Product usage patterns
- Supplier relationships
- Digital thread traceability
- Design and manufacturing bottlenecks
The Neo4j Graph Data Science library serves as an inspiration for what’s possible. OpenBOM aims to harness graph algorithms to deliver actionable insights, such as shortest paths in supply chains, dependency cycles in BOMs, and predictive analytics for component failures.
Conclusion
OpenBOM’s integration of graph databases, combined with its NoSQL backbone, is a key data management differentiator in the PDM/PLM allowing OpenBOM to serve as an ideal place for engineering and manufacturing teams to make analysis of their product data. The era of graph-powered PLM systems has arrived, offering capabilities far beyond what traditional SQL-based platforms can achieve.
If you’re excited about the potential of graph models in PLM and want to explore OpenBOM’s innovative features, reach out to us. The time to reimagine PLM with graph technology is now.
More examples will be coming soon. Stay tuned…
In the meantime REGISTER FOR FREE and check how OpenBOM can help you.
Best regards,
Oleg
Join our newsletter to receive a weekly portion of news, articles, and tips about OpenBOM and our community.