OpenBOM’s latest product update is out and it includes a new visual dashboard, which I’m very excited about!
I know new is exciting, and new in software terms usually means changes to workflows, but no worries, we have put much thought into how these new updates will impact your existing workflows.
In this article, I will go into details on how to get to the stuff that you used before and how to use the new visual dashboard.
Your Old Dashboard Is Still Alive
Let’s start by taking a nice and relaxing breath… Everything you had before in OpeBOM is still available. Existing dashboards – All BOMs, All Top Level BOMs and others are in place and they just shifted down a bit.
Our new dashboard comes at the beginning first, but if you switch to the old dashboard and come again to OpenBOM the old dashboard will take its place and open by default.
So, if you feel uncomfortable for the first few days with our new dashboard redesign, no worries, you can take your time and gradually morph into using our new setup. Take some time to discover the new features, functions and learn how to use them before jumping all in.
New Dashboard – It Is All About ITEMS
Everything is an item in OpenBOM. Item can be a product, sub-assembly, component, standard part, material, labor, etc.
You define Items using OpenBOM Catalogs. Items are taking a central place in OpenBOM’s new user experience.
While everything is an item, items may also have BOMs. You would typically define a BOM for assembly and you won’t define a BOM for a standard component, labor, or materials. You might define a BOM for a purchased assembly, but you can treat it differently.
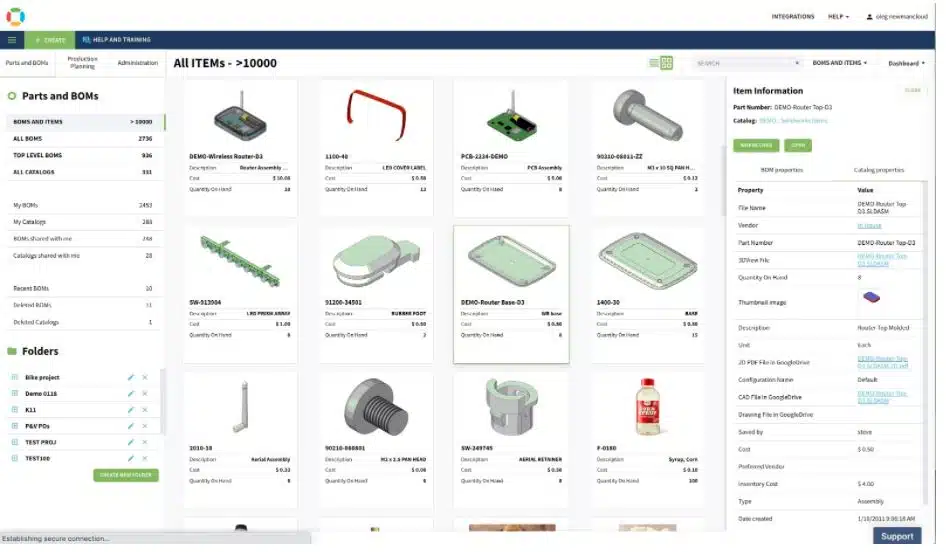
So, this is what the new OpenBOM Dashboard (BOMs and ITEMS) gives you- easy access to all items. It doesn’t matter where the items are defined – all these items will come in the list of tiles in the new dashboard.Items vs Item Instances
The new dashboard also gives you access to two records – items and item instances. Just to remind you OpenBOM basics data model – there are items defined in the catalog(s) with data properties (eg. cost, description, mass, etc.) and there are item instances – created when you insert an item in a BOM.
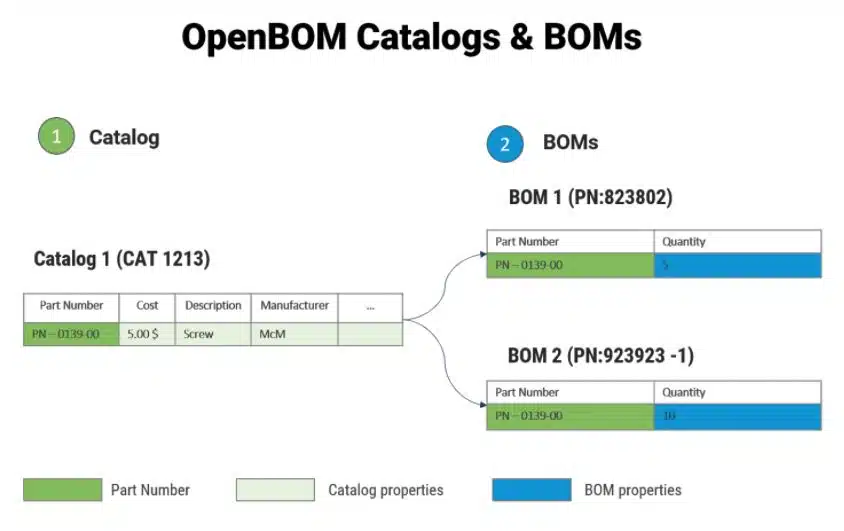
So, if you get a screw and insert it in 5 different BOMs, you will get 6 results and you can clearly differentiate between them.
New Dashboard – It’s All About Search
The new dashboard is search-driven. This means, you’re getting access to all items automatically and you can use a very easy and familiar search-driven user interface to find what you need. The dashboard searches for all the data in the items and BOMs.
Tiles or Lists – Which One Do you need?
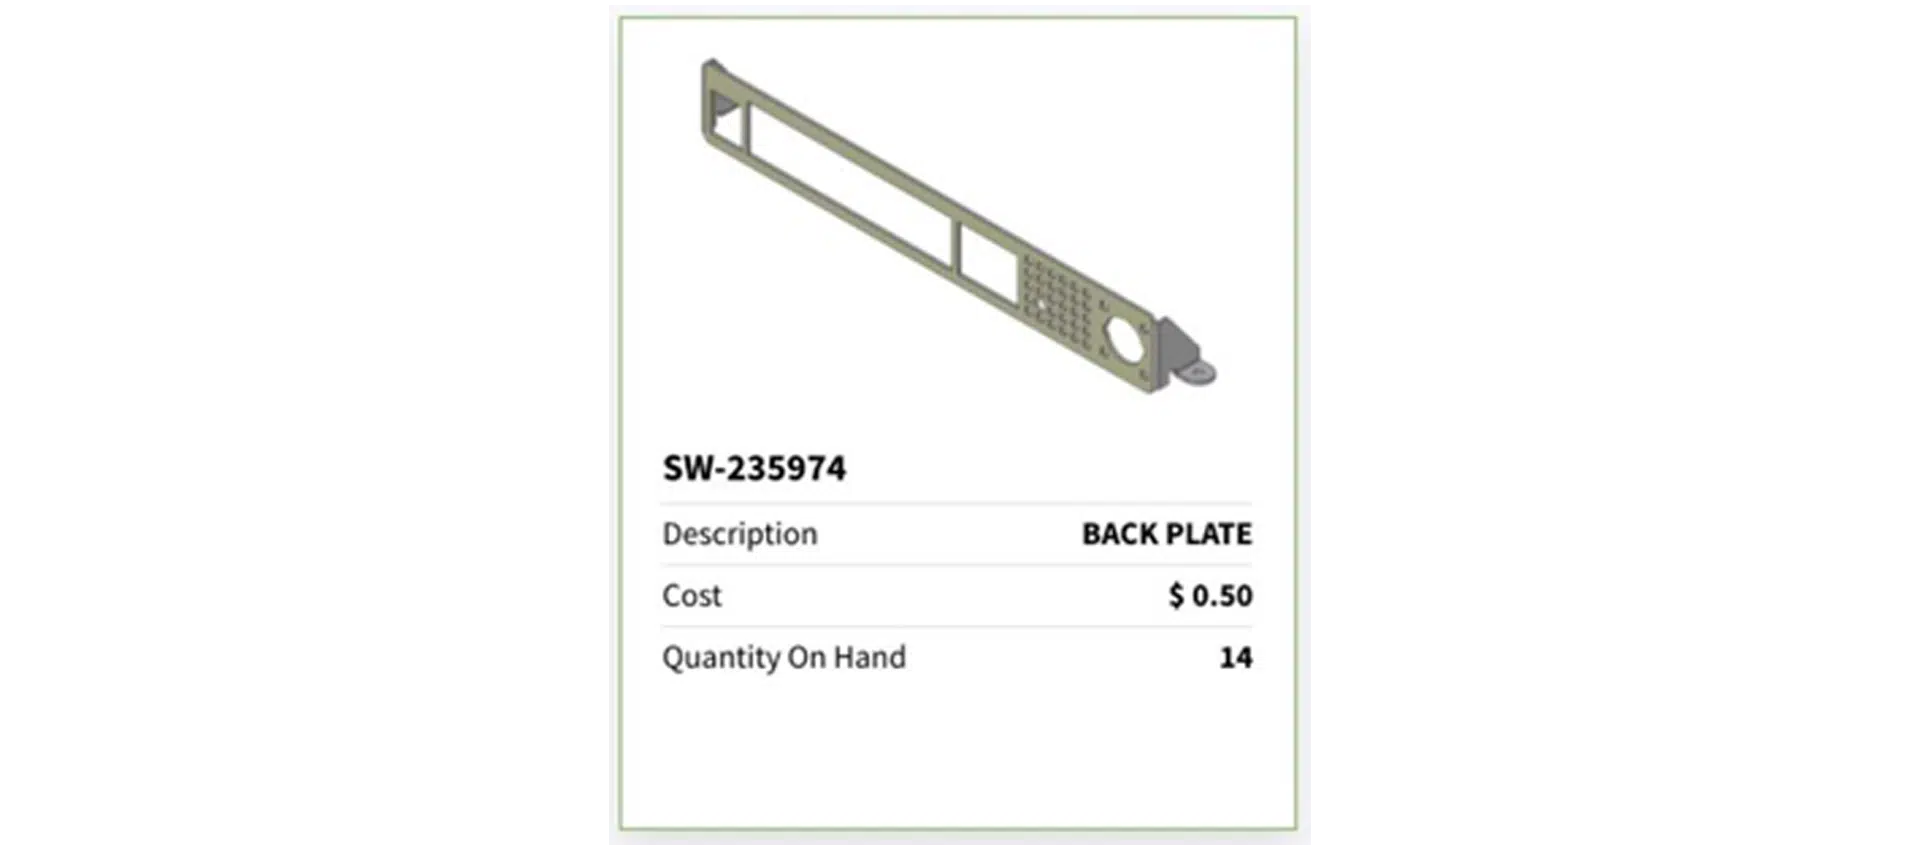
There are two separate modes in the dashboard – “list, and tiles” and you can switch between them. The tiles show a big image of the item and the first four properties from the list. The first property is always Part Number.
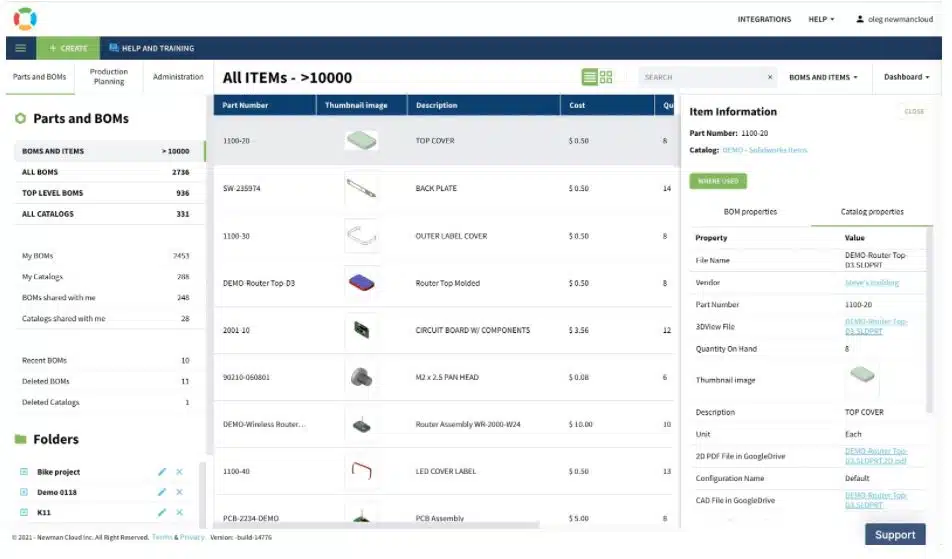
The list shows you the all properties in the list in the way they ordered in the user-defined view. To change the order you need to edit a user-defined view via the OpenBOM administration user interface.Should I always use the “Dashboard” view?
Not really. OpenBOM’s new dashboard can be used with any user-defined view. So, you can arrange multiple sets of views and use them to visualize different sets of information easily.
What is coming next to a new Dashboard?
The current new dashboard is just a first step in providing a visual interface to the data you’re managing using OpenBOM. We understand that many additional features will be needed. Here is a shortlist of what features are coming and what we are still working on.
- Easy filter (eg. Only BOMs, property ranges, etc.)
- Additional sort options (in addition to reverse order by date)
- Unified Item info panel (the same item info panel used in BOM and catalogs will be coming to the new dashboard as well).
- Graphs and Charts (later)
Conclusion
I hope you’ll like the new Dashboard as much as we do here at OpenBOM, and will find it useful to better understand and navigate through the data in your OpenBOM account. We need your feedback – tell us what features we’ve missed and what you want to have in the new dashboard.
Best, Oleg
Join our newsletter to receive a weekly portion of news, articles, and tips about OpenBOM and our community.