At OpenBOM, we are constantly striving to refine and simplify the user experience amidst the complexity of data that engineers and manufacturing companies handle daily. Recognizing the critical need for efficient data exploration, we introduced the Graph Navigation feature last year, significantly enhancing how users interact with our platform. If you haven’t explored this feature yet, we highly recommend checking out our previous article on its benefits – Usage of Graph Navigation in Where Used BOM queries.
Graph Navigation is not just an add-on feature; it’s becoming integral to numerous aspects of the OpenBOM user experience, aiming to facilitate easier data traversal for OpenBOM users. A prime example of this integration is the evolution of our “Where Used” panel.

The Evolution of “Where Used” Command
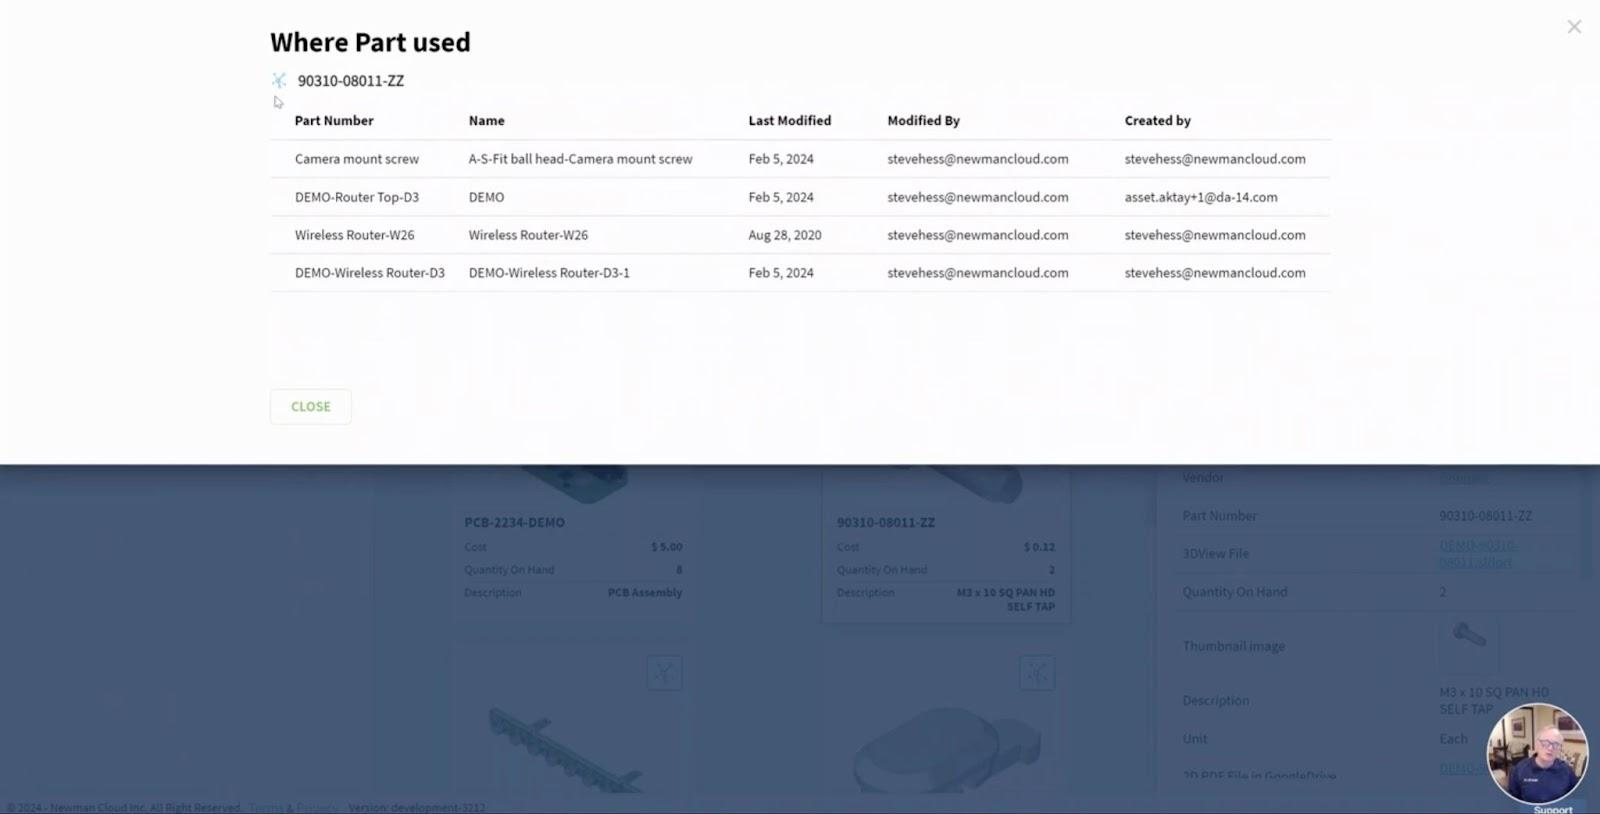
Traditionally, the “Where Used” command in OpenBOM provided a straightforward list showcasing the assemblies where a specific item was utilized. This function, while useful, offered limited navigational capabilities, prompting us to rethink and expand its utility.
Introducing Graph Navigation to “Where Used”
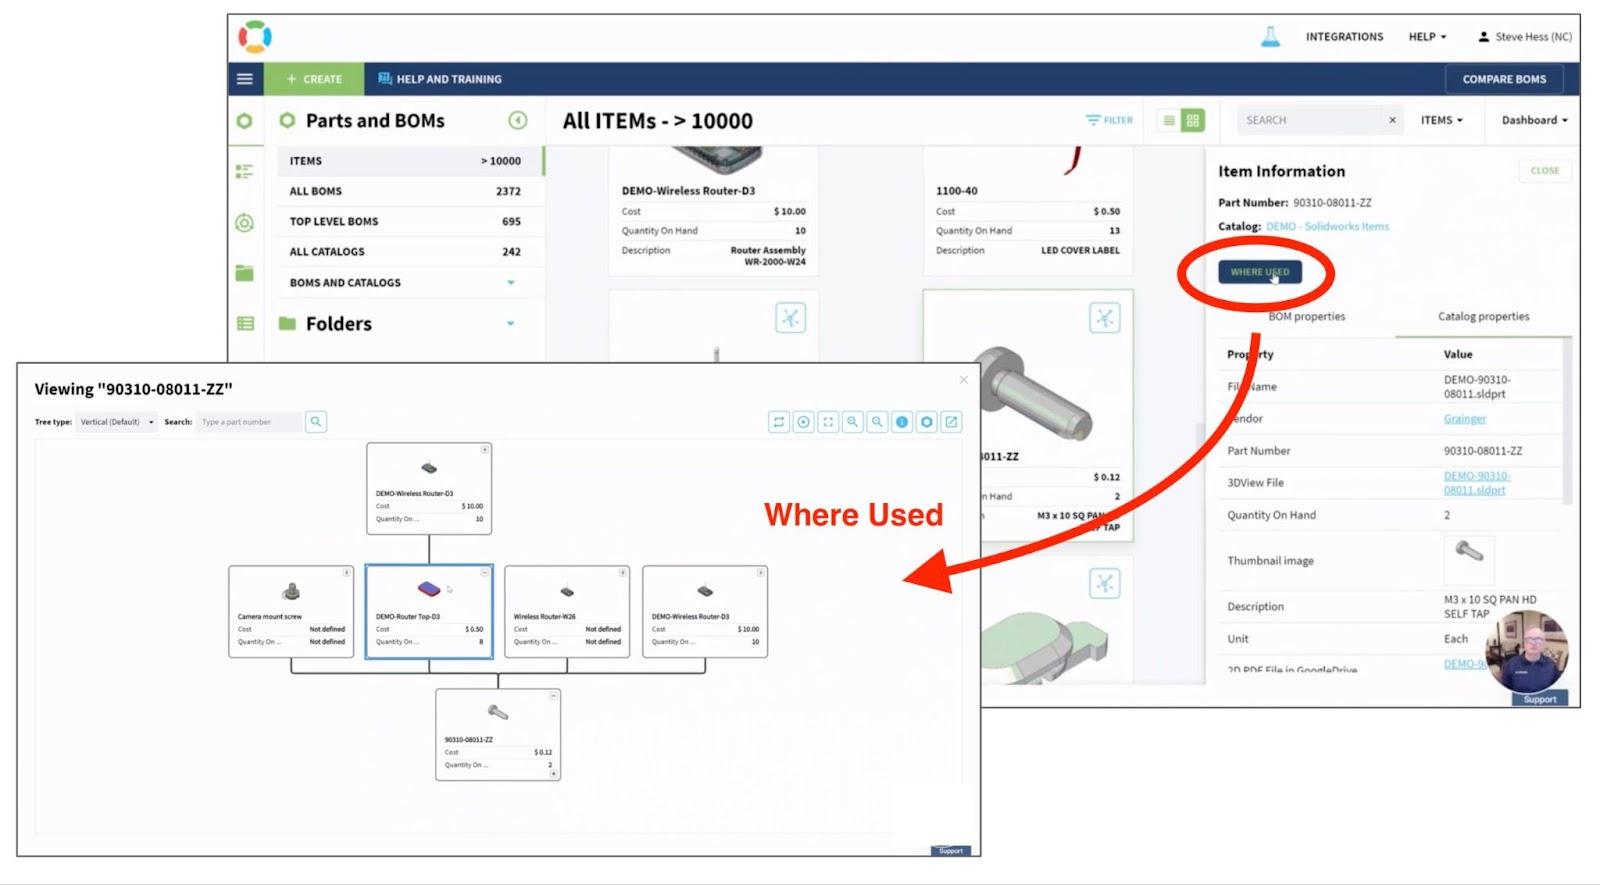
We’re thrilled to announce the addition of Graph Navigation to the “Where Used” panel. This enhancement allows users to not only see where an item is used but also navigate through this data more intuitively.
By implementing graph-based navigation, we’re making it easier for users to traverse upwards through the data, understanding the hierarchy and connectivity of components in a more natural and visual manner.
Upcoming Enhancements
Our commitment to improving OpenBOM’s user experience doesn’t stop here. Later this year, we plan to introduce functionality that will allow users to generate a more comprehensive where-used report. This report will provide straight access to top-level assemblies in “where used” queries. Also, we are considering mechanisms for optional expansion of the graph, providing a great level of insight and overview of where specific items are used across all projects and assemblies.
Demo Video
To give you a better understanding of these improvements, we’ve prepared a demo video showcasing the enhanced “Where Used” panel in action. This video will guide you through the new features and demonstrate the practical benefits of graph navigation in the OpenBOM interface.
Conclusion
Graph-based navigation is rapidly becoming a cornerstone of the OpenBOM user experience, reflecting our belief in its potential to revolutionize how our customers interact with complex data. The enhanced “Where Used” feature is just the beginning; we plan to integrate graph navigation across many other areas of OpenBOM, further simplifying and enriching the user experience.
Stay tuned for more updates, and don’t miss the opportunity to see how OpenBOM can streamline your manufacturing processes. Register for free today and take the first step towards a more connected and intuitive data management experience.
REGISTER FOR FREE and check how OpenBOM can help you today.
Best regards,
Oleg
Join our newsletter to receive a weekly portion of news, articles, and tips about OpenBOM and our community.