In my previous article Graphs, Networks, and BOMs Part One and Part 2 I introduced how Graph and Networks can be used to represent Bills of Materials and how data can be aggregated from multiple BOMs in a single network. The aggregated graph structure is a very important asset that can be used for future analysis and building intelligence.
Just to remind you what I did in the previous article. In this example, I created a single graph by aggregating nodes and edges. A result – weighted graph can be a source of various analyses.
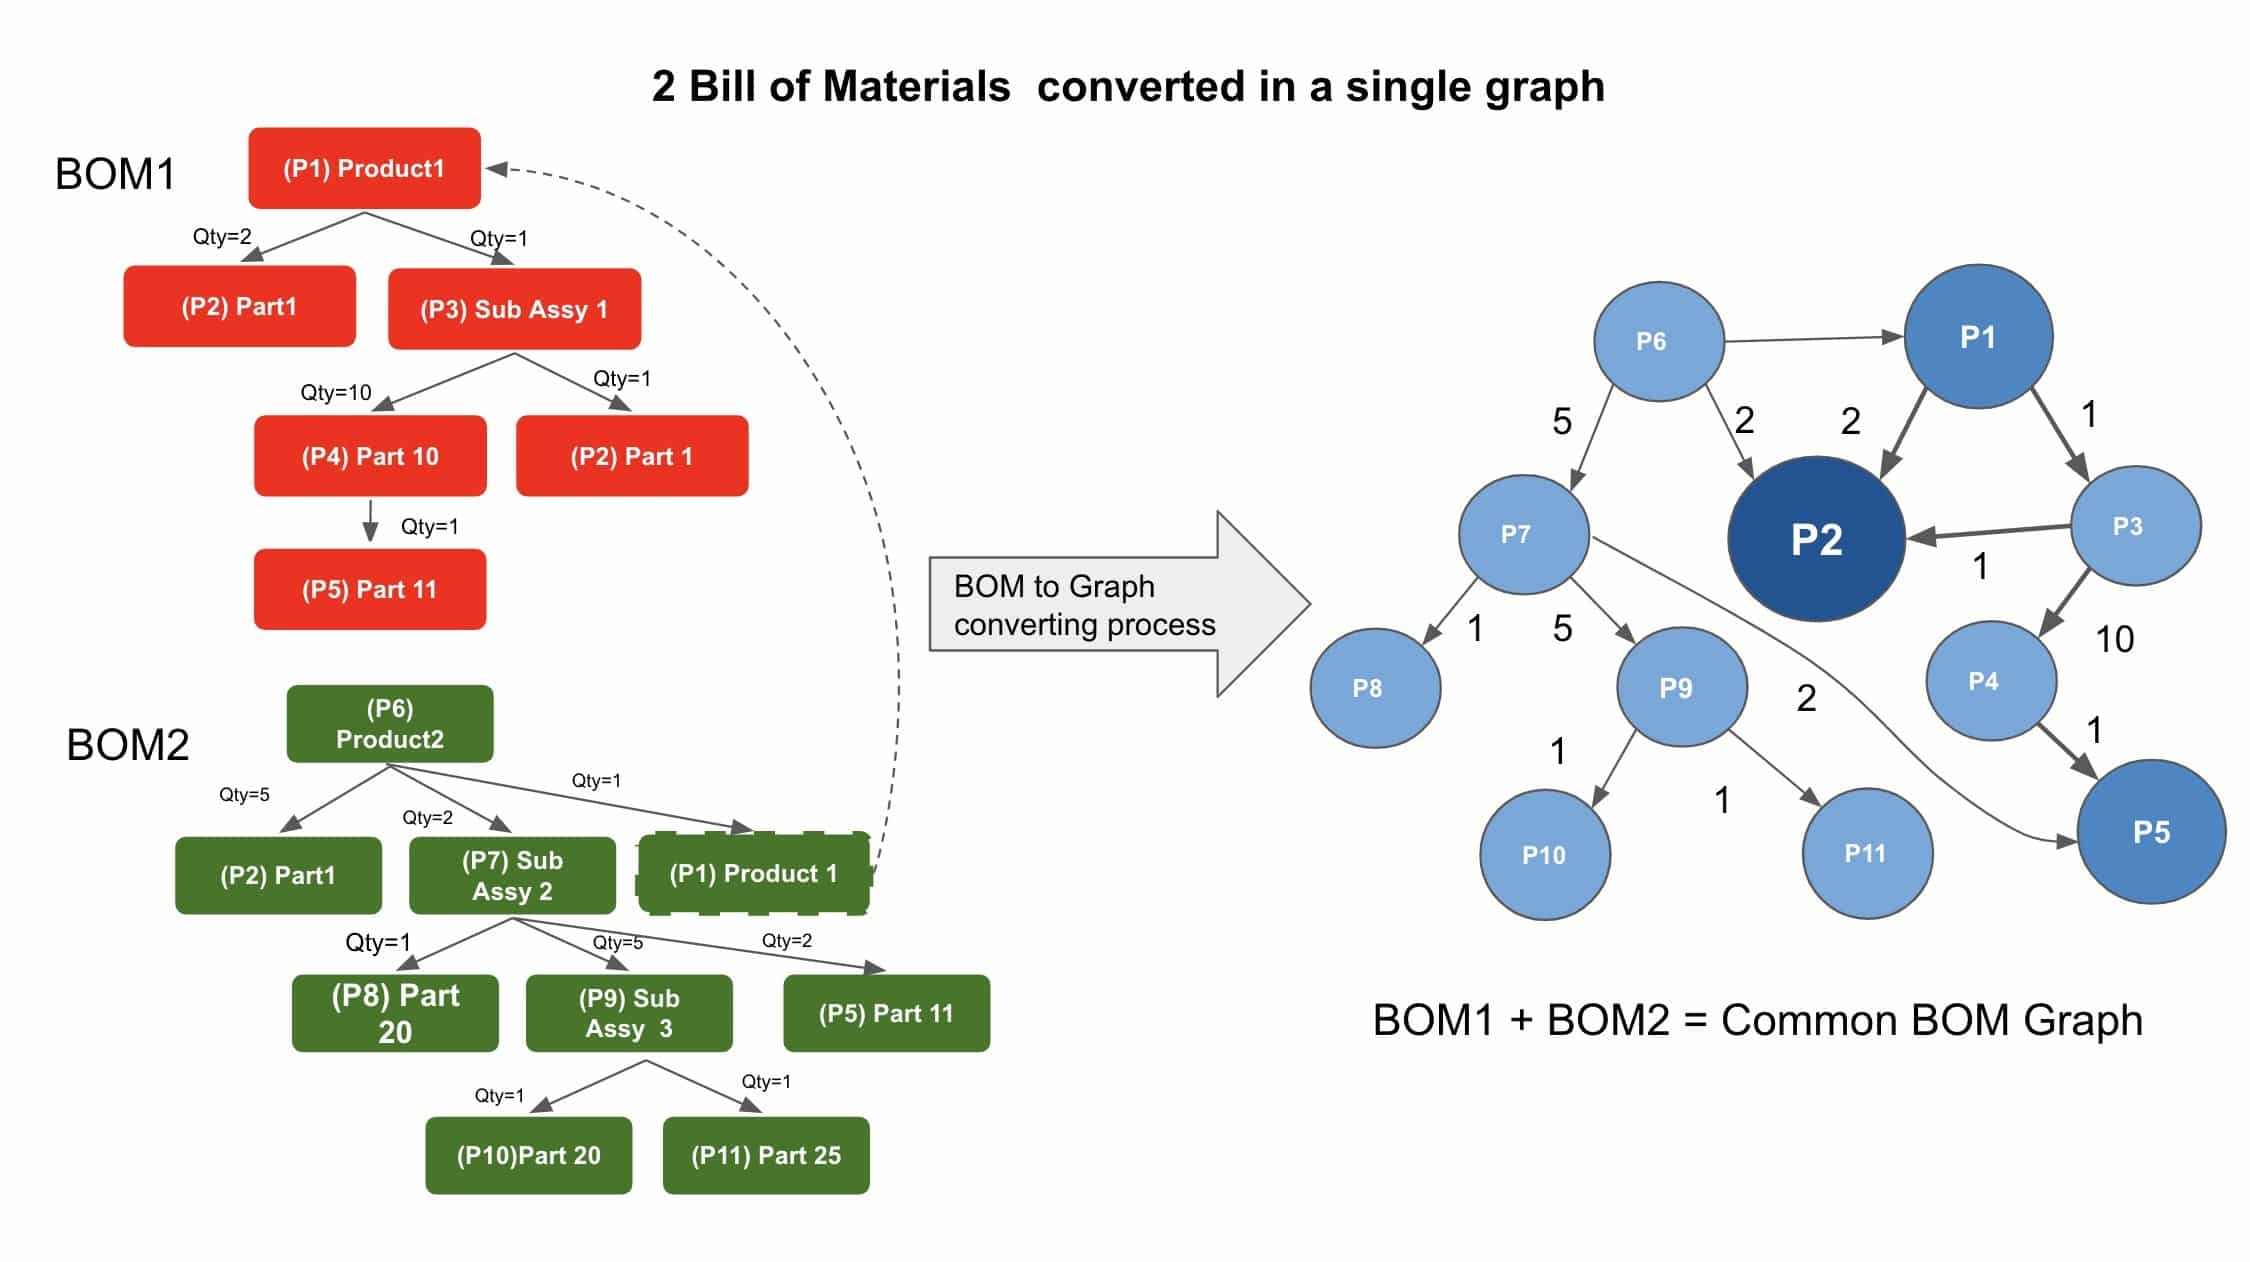
Below I want to bring some examples of how graph theory and analysis can be applied to the aggregated network resulted from multiple Bill of Materials.
Topological Analysis and Clustering
The set of algorithms about clustering can bring an interesting perspective on connectedness between products and their parts. By analyzing the connections between parts, we can identify common groups (clusters) and the common graph between two products, which can help us to build a sense of dependencies and commonalities between products. Totally disconnected graphs and opposite to that – no clusters can help us to get an interesting insight into the product, components, suppliers, and their dependencies. We can drive a conclusion about similar attributes and grouping of nodes.
After all, clustering and other topological analysis will help us to drive the conclusion about how product structure (and their dependencies) can be integrated or disintegrated, which will lead us towards decision-making process about risks in inventory planning, supply chain, maintenance parts, and many other aspects.
Centrality
The application of centrality can help us to figure out what are the most important nodes. In such a way, we will be able to identify critical elements of the product structure, their contractors, and suppliers.
An old example of centrality was PageRank in the Google algorithm. But, in modern product development applications, the centrality of nodes can play a novel role in the attempt to eliminate some part’s importance and opposite – to decide where the critical focus and/or risk.
Similarity
Last but not least, similarity algorithms can help you set comparison to score how alike individual graph nodes are based on their links and properties. The foundation of similarity can lead to many decision-making algorithms starting from the recommendation of suppliers, contractors parts, and developing personalized products.
An example of a similarity application will be the identification of re-usable parts, components, and suppliers. In a current COVID-19 world, similarity can help to find suppliers that can be used for product development scale or compensation for a supplier that is not available for the moment.
What is OpenBOM uniqueness?
The unique capability of OpenBOM is the ability to build an aggregated graph of information by using product data. The multi-tenant characteristics of OpenBOM allow you to create an aggregated graph using an anonymized data set and once it is done, use it for various decisions – suppliers search, part purchasing decisions, identifying weak part, and single supplier search. The knowledge about product structure connected together provides a unique data analysis and decision-making tool such as OpenBOM.
Conclusion
The network (graph model) artifact created as a result of a combination of multiple Bill of Materials can provide a model for the analysis of product information and dependencies between objects used to represent this graph. As you can see some very basic algorithms applied to this data set can provide a unique set of technologies to optimize product development and decision making in supply chain and contract manufacturing.
I’m excited to talk about multiple applications of Graph Theory in graphs created from the Bill of Materials and related information. If you, like me, love graph theories and algorithms, please reach out- I’d be happy to discuss it.
Best, Oleg @ openbom dot com.
Want to learn more about PLM? Check out my Beyond PLM blog and PLM Book website
Read OpenBOM customer reviews on G2 Crowd to learn what customers are saying about OpenBOM.
Join our newsletter to receive a weekly portion of news, articles, and tips about OpenBOM and our community.