In the manufacturing industry, it is important to be able to analyze change quickly and accurately. While it sounds like a very simple and important goal, the reality of manufacturing businesses is not making to do it in a very easy way. The data is not well organized and located in multiple databases, Excel files, and other tools. OpenBOM vision is to help companies to identify potential impacts from changes in a product or process.
At OpenBOM, we developed flexible and robust data modeling tools helping engineering teams, manufacturing companies, and contractors to bring their data in from multiple sources and make this analysis. The foundation of the OpenBOM data model is a graph database capable to trace relationships between pieces of information and use it in multiple queries. This graph model can be used to examine multiple data points and determine the risk of any given change in order to make informed decisions. Let’s take a closer look at this work now and how OpenBOM plans to deliver more Impact Analysis services in OpenBOM 2023 roadmap.

The Benefits of Graph Model and Its Impact Analysis
OpenBOM is an online platform that enables manufacturers to manage all aspects of the product life cycle, from design to production. Earlier in the process of OpenBOM creation, we identified that the future of manufacturing will be dependent on the ability of the systems to build a relevant data representation of the information about products. To make it happen we built an OpenBOM graph model, which allows the creation of relationships between items and related attributes and uses it for a variety of analyses to determine what impacts changes will have on the BOM structure and other elements of product and process – cost, suppliers, other products, and other dependencies.
Why Graphs?
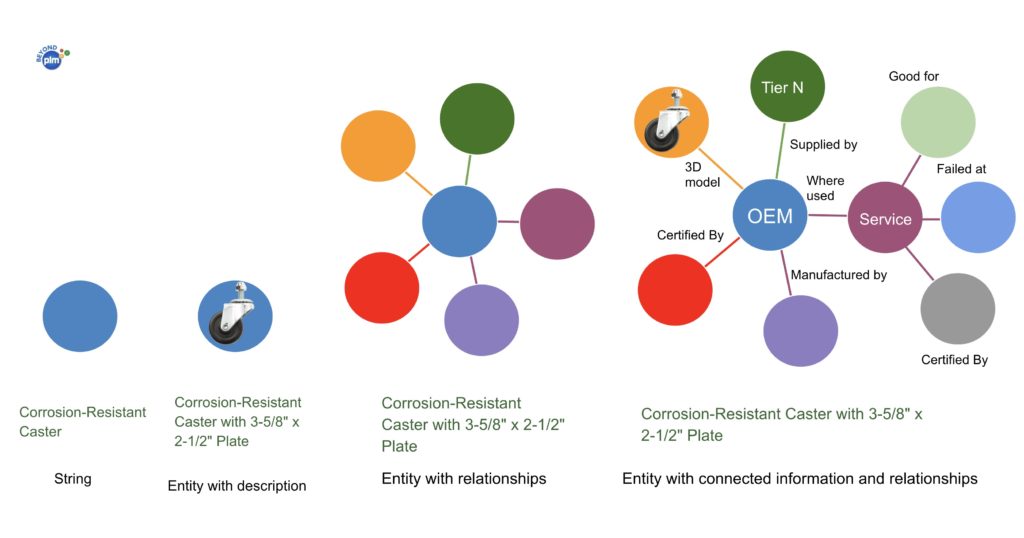
The graph is a very powerful data model, which slowly became more popular because of the simplicity and power that is inherited in this model. In our view, graphs will revolutionize the way engineering and manufacturing companies will be thinking about everything they do. Check my earlier article – Manufacturing knowledge graph, why it matters, and what is PLM’s role. Here is an example of data model transformation into a graph.
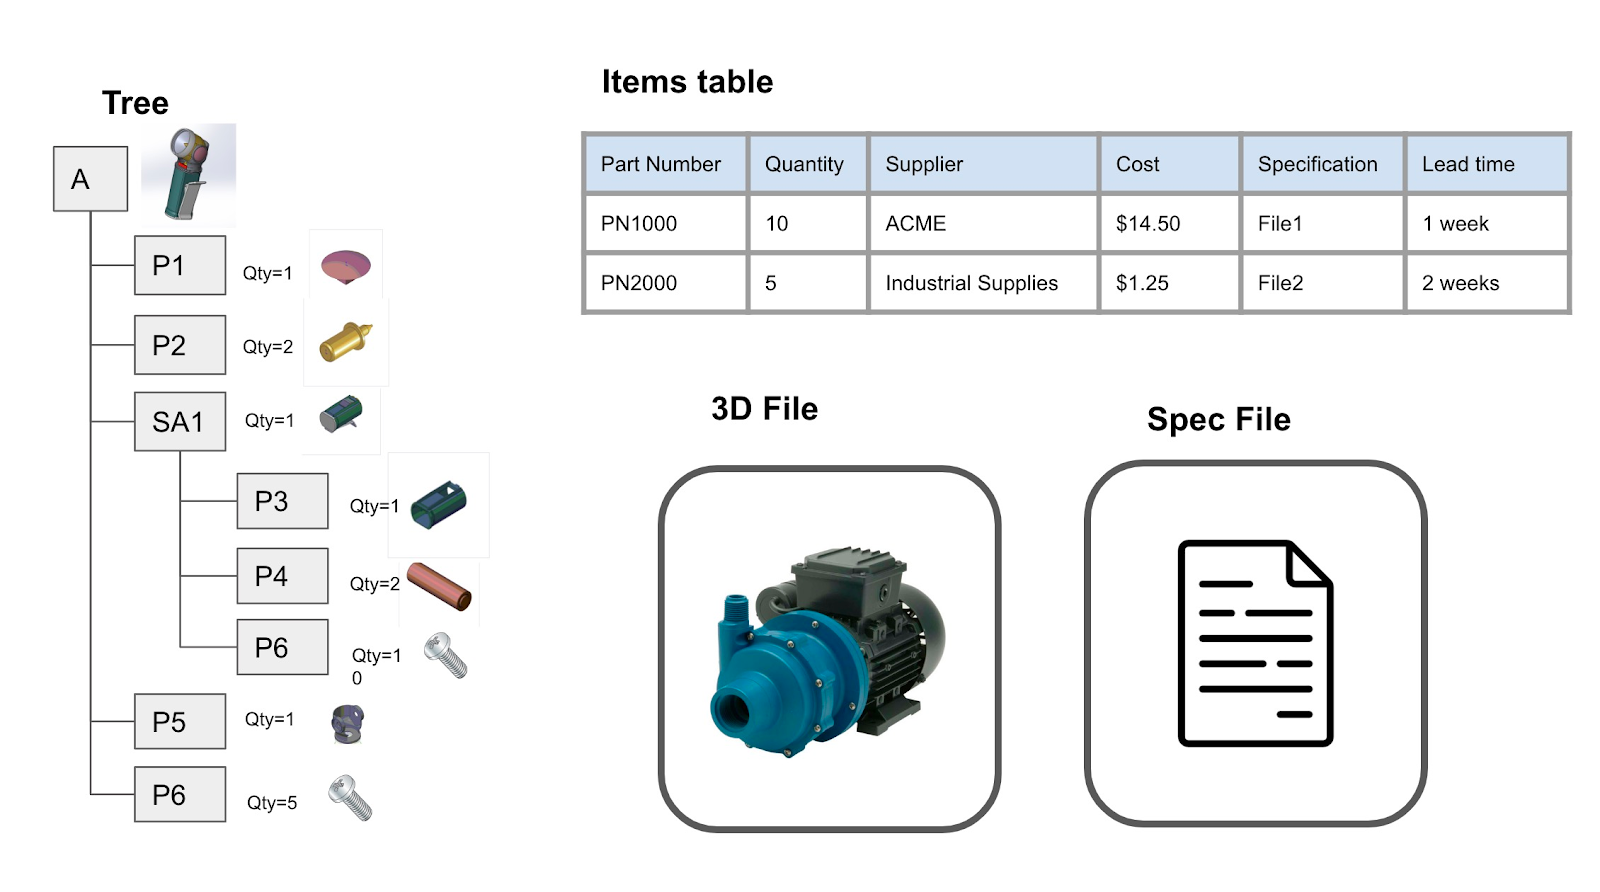
PLM data modeling – File, Table, Tree, Graph
The power of the graph is the ability to retain the rich semantics of the data while providing a very powerful way to query the data. In the following picture, I can show you how familiar product data elements can be transformed into a graph model.
Three of the most popular data paradigm in CAD and PLM are Files, Tables, and Threes (hierarchies). Everyone is familiar with them and they are used heavily in all PDM and PLM systems. In the following example, I can show you how information is traditionally viewed in the system.
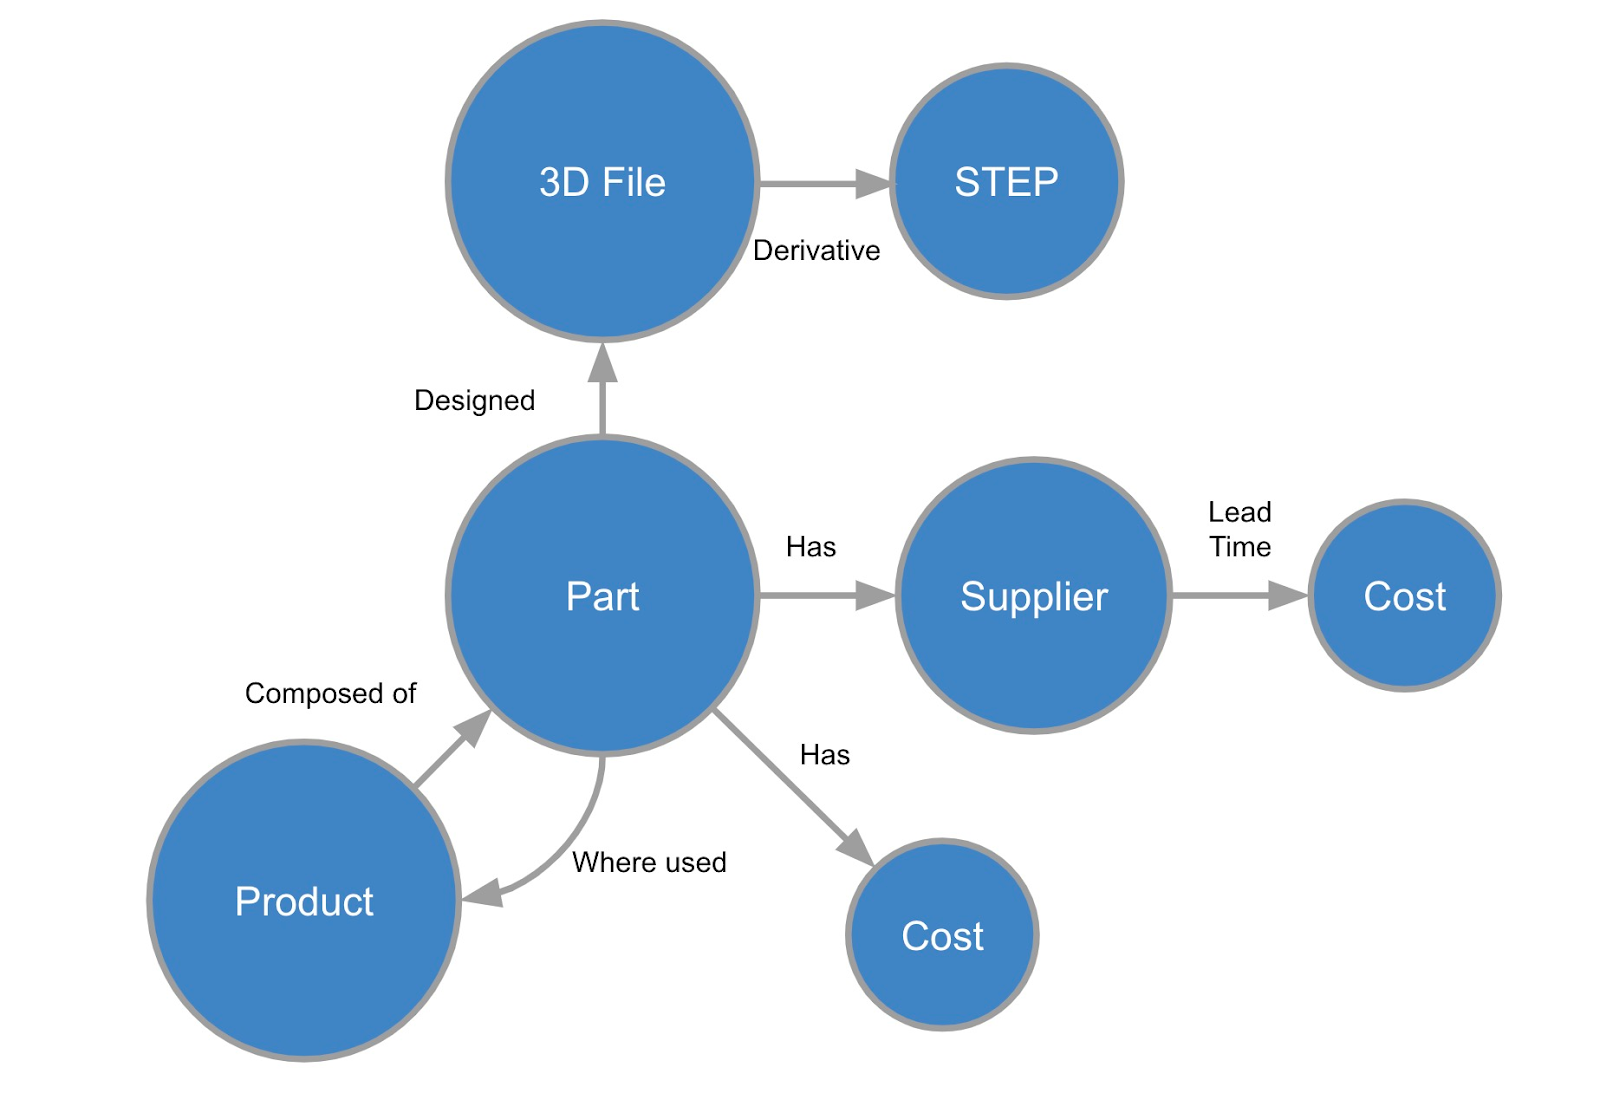
However, this information can be transformed into a graph that explains not only the data but relationships and semantic dependencies between data. The schema in the picture below is simplified. The real data is more complex. Capturing these relationships and dependencies allow for building analysis and decision-support tool to help manufacturing companies.
Heads up: OpenBOM Visual Graph Models and Impact Analysis
Here is what is coming. OpenBOM’s Graph Model allows users to create detailed graphical representations of their BOM data, showing the relationships between parts, assemblies, suppliers, and more. This visual representation makes it easier for users to spot problems and identify areas that could use improvement in their BOMs. The graph also provides an easy way for teams to collaborate on projects by sharing the graph with team members who can then view it in real time.
The Graph Model also includes an Impact Analysis feature, which allows users to see how changes made to the BOM structure will affect other parts of the project. For example, if a user changes one part in the BOM, they can immediately see what impact this change has on other parts in the graph. This helps prevent costly mistakes or unexpected delays due to unintended consequences caused by making changes to a project’s BOM structure.
For instance, when working with legacy systems, users may not be aware that changing one component may have ripple effects throughout their system because those components are connected in unforeseen ways. With OpenBOM’s Impact Analysis feature, these potential issues can be identified upfront before any changes are made so that teams can make informed decisions about how best to proceed with any modifications necessary for the successful completion of their project.
Conclusion:
OpenBOM’s Graph Model is a powerful foundation used to model information related to the product, all dependencies, and process activities in OpenBOM. This model allows to create transparency in product data management and defines how specific product characteristics can impact multiple levels of dependencies in product design and production planning. This is how OpenBOM is built, but we are taking the next step in providing OpenBOM users to fully customize the graph relationships and build it in a way that supports impact analysis and decision making
Analysis features offer tremendous value for manufacturers looking for ways to improve their product life cycle management processes while reducing the risk associated with making changes late in the game after a product has been released into production. By providing both a thorough visual representation of data as well as an easy way to identify potential impacts associated with making structural changes after development has started, OpenBOM will offer a SaaS that helps teams reduce risk while optimizing their products and processes at every stage of the product lifecycle.
Interested to learn more about OpenBOM impact analysis tools? Contact us directly and we would be happy to discuss it with you.
Best, Oleg
Join our newsletter to receive a weekly portion of news, articles, and tips about OpenBOM and our community.