OpenBOM is a SaaS digital thread platform for collaborative product lifecycle management (PLM) and Bill of Materials (BOM) management. Part of OpenBOM’s vision is to provide a user experience that allows accessing information in a variety of forms, slice and dice information using filters, allowing to navigate product dependencies such as vendors, suppliers, and contractors, create multiple views and provide analytical views on product data.
Earlier this year, when sharing insight on OpenBOM 2023 Roadmap, I mentioned that OpenBOM is planning to introduce a variety of intelligent analytical tools to navigate through multiple product data representations, make impact analysis, and provide other mechanisms to access data using visualization that is different from traditional OpenBOM collaborative grid data format.
Today, I want to give you a first glimpse of what is coming soon as a technical preview to OpenBOM – the ability to use graph navigation between multiple data elements in OpenBOM – Items, Vendors, Orders, etc. and soon-to-be-introduced custom object types. Altogether, it will offer a unique way to navigate through complex product data with its Graph Navigation feature.

Product Structure Visualization
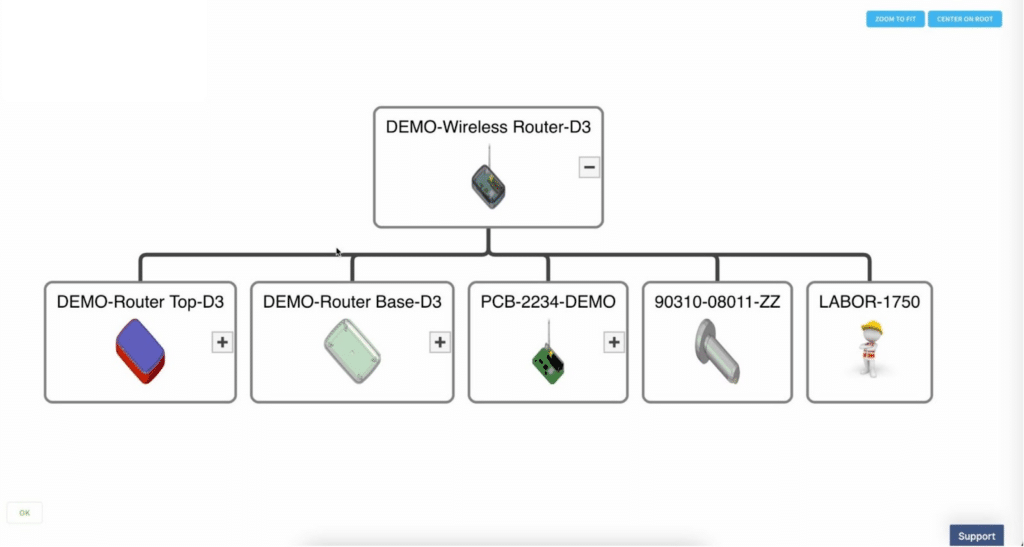
The first to come will be product structure visualization. The Graph Navigation feature in OpenBOM provides a visual representation of the product structure, allowing users to easily understand the relationships between different parts, subassemblies, and products. This feature allows users to create, edit, and manage product data, enabling them to make informed decisions about the product’s design, cost, and availability.
The Graph Navigation feature in OpenBOM is intuitive and easy to use. Users can navigate through the product data by clicking on the nodes in the graph. The nodes represent different parts, subassemblies, and products. The edges represent the relationships between the nodes. By clicking on a node, users can view the details of the part, such as its properties, cost, and availability. Users can also view the relationships between the part and its subassemblies and products.
In the picture below you see a regular view of a multi-level product structure presented in a way you’re all familiar with – an editable collaborative grid.
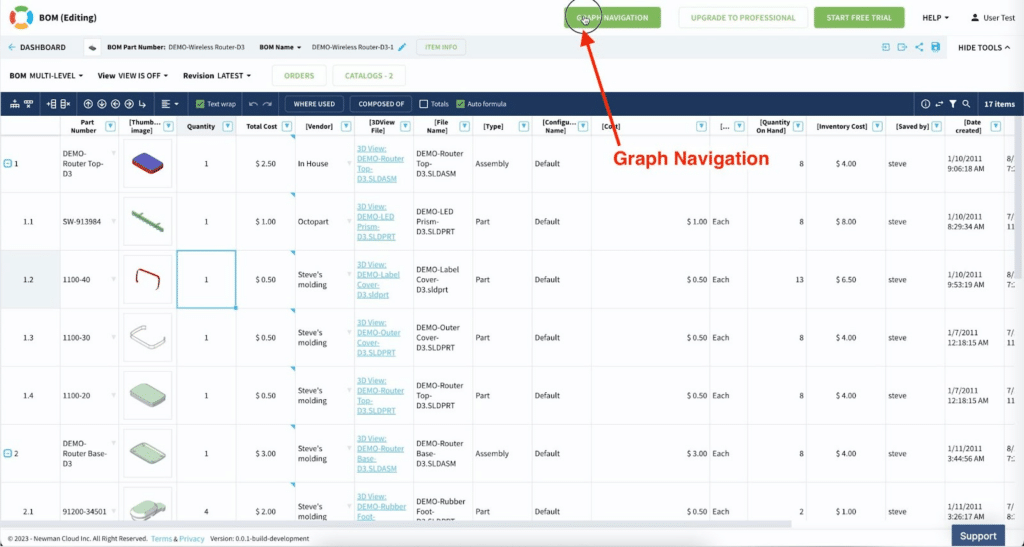
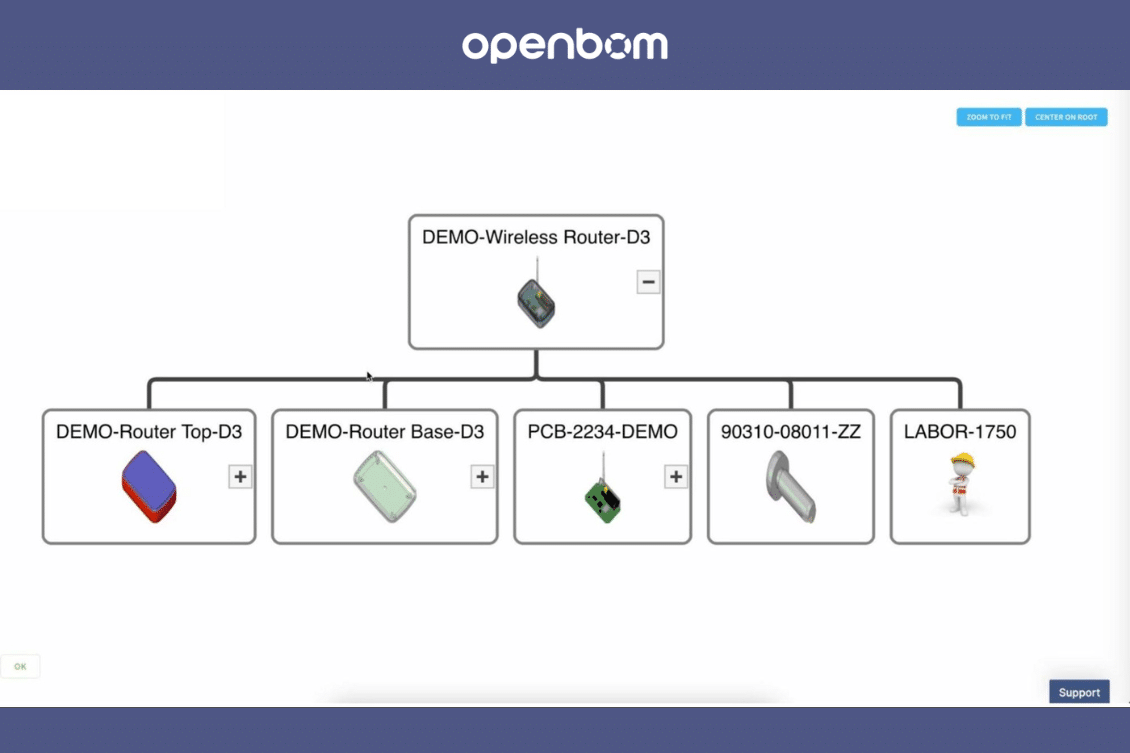
A new graph navigation feature will allow you to turn this view into a visual graph (tree) presenting product structure and allowing you to navigate all these components – assemblies, parts, and dependencies.
OpenBOM Graph Navigation provides users with a real-time view of their product data, allowing them to make changes and updates on the fly. This feature is particularly useful when working with large and complex product structures. Users can easily identify and locate parts, subassemblies, and products, saving time and reducing errors.
Another advantage of the Graph Navigation feature is that it enables users to create and manage custom views of the product data. Users can create different views based on their specific needs, such as cost, availability, or design. This feature allows users to quickly access the information they need without having to navigate through the entire product structure.
Video Preview
Check out a super early preview of OpenBOM Graph Navigation capabilities to explore product structure.
OpenBOM Graph Navigation also integrates with other features in the OpenBOM tool, such as the Collaborative BOM Editor and the Part Catalog. Users can easily switch between different views and features, making it easier to manage their product data.
Conclusion
OpenBOM Graph Navigation will become the first step to introduce a series of new features to visualize data and provide an analytical perspective on product information. It will enable users to easily navigate through complex product data. This feature provides users with a visual representation of the product structure, allowing them to identify and locate parts, subassemblies, and products quickly. The feature is intuitive and easy to use, making it a valuable tool for product lifecycle management, BOM management, and product analytics.
Like where OpenBOM is going with product visualization and analytics? Contact us and we would be happy to discuss how OpenBOM can help you.
REGISTER FOR FREE and to get access to your free 14-day trial.
Best, Oleg
Join our newsletter to receive a weekly portion of news, articles, and tips about OpenBOM and our community.