Welcome to another article featuring the OpenBOM introductory video demo series. Check out our earlier articles from our series below.
In today’s video, we will talk about different BOM visualization types. While OpenBOM’s flexible data model allows the organization of a very comprehensive multidimensional multi-disciplinary product structure, BOM visualization types help you to explore and traverse this information with ease and simplicity.

BOM visualizations: Single-Level, Multi-Level, and Flattened
OpenBOM is managing a complete product structure combined with items and bills of materials (BOMs). This model allows you to create a comprehensive data representation of the product. However, to edit and visualize the structure, you can use different BOM visualization methods.
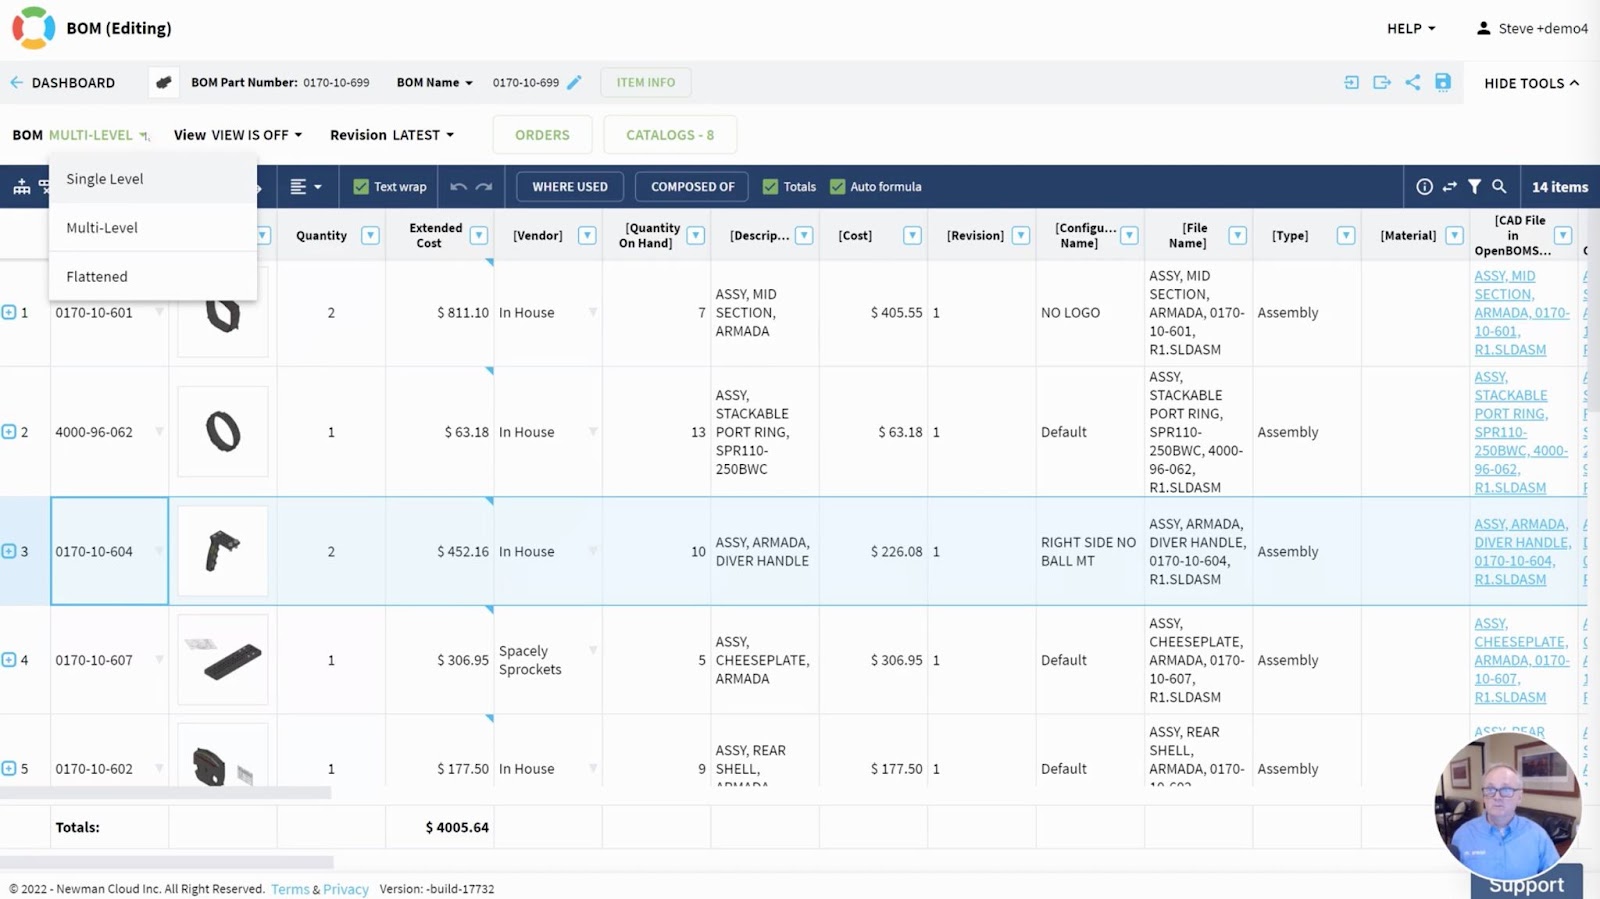
OpenBOM provides multi-level visualization. This is the most frequently used visualization when you need to define the information and explore dependencies between product structure levels. Multi-level BOM gives you a way to navigate through the levels of item information (infinite up and down). You can edit information on multiple levels and OpenBOM keeps the information structured and maintains “where used” dependencies.
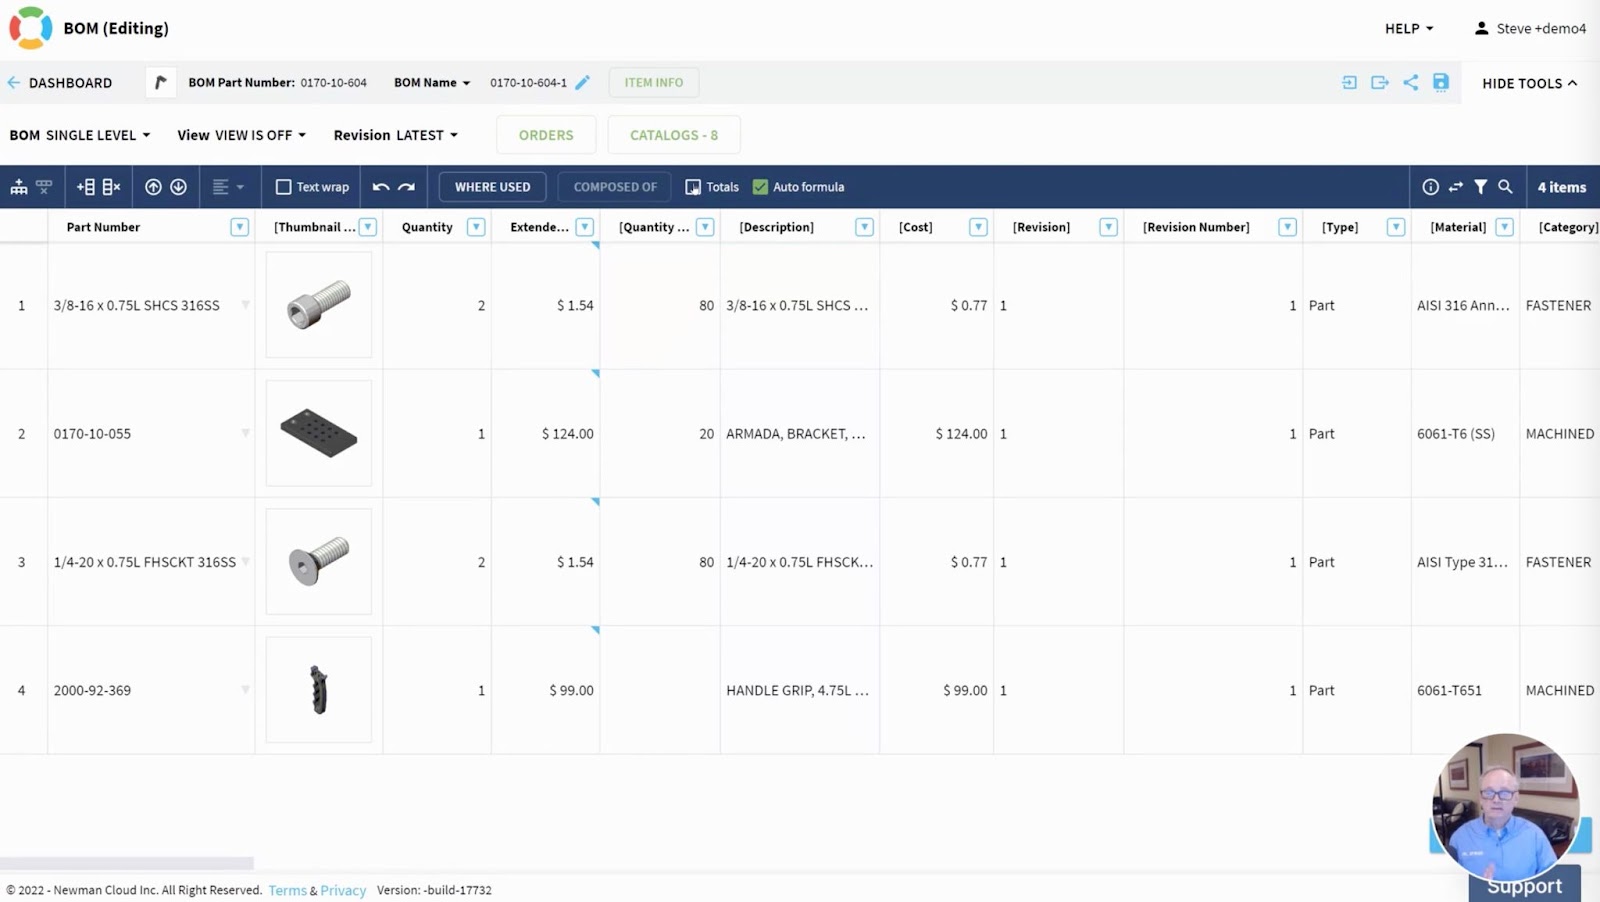
To have a slightly different and more simple visualization, you can use a single-level. It will only present the data at a single BOM level. To navigate between multiple layers, you can use “where used” and “composed of” commands.
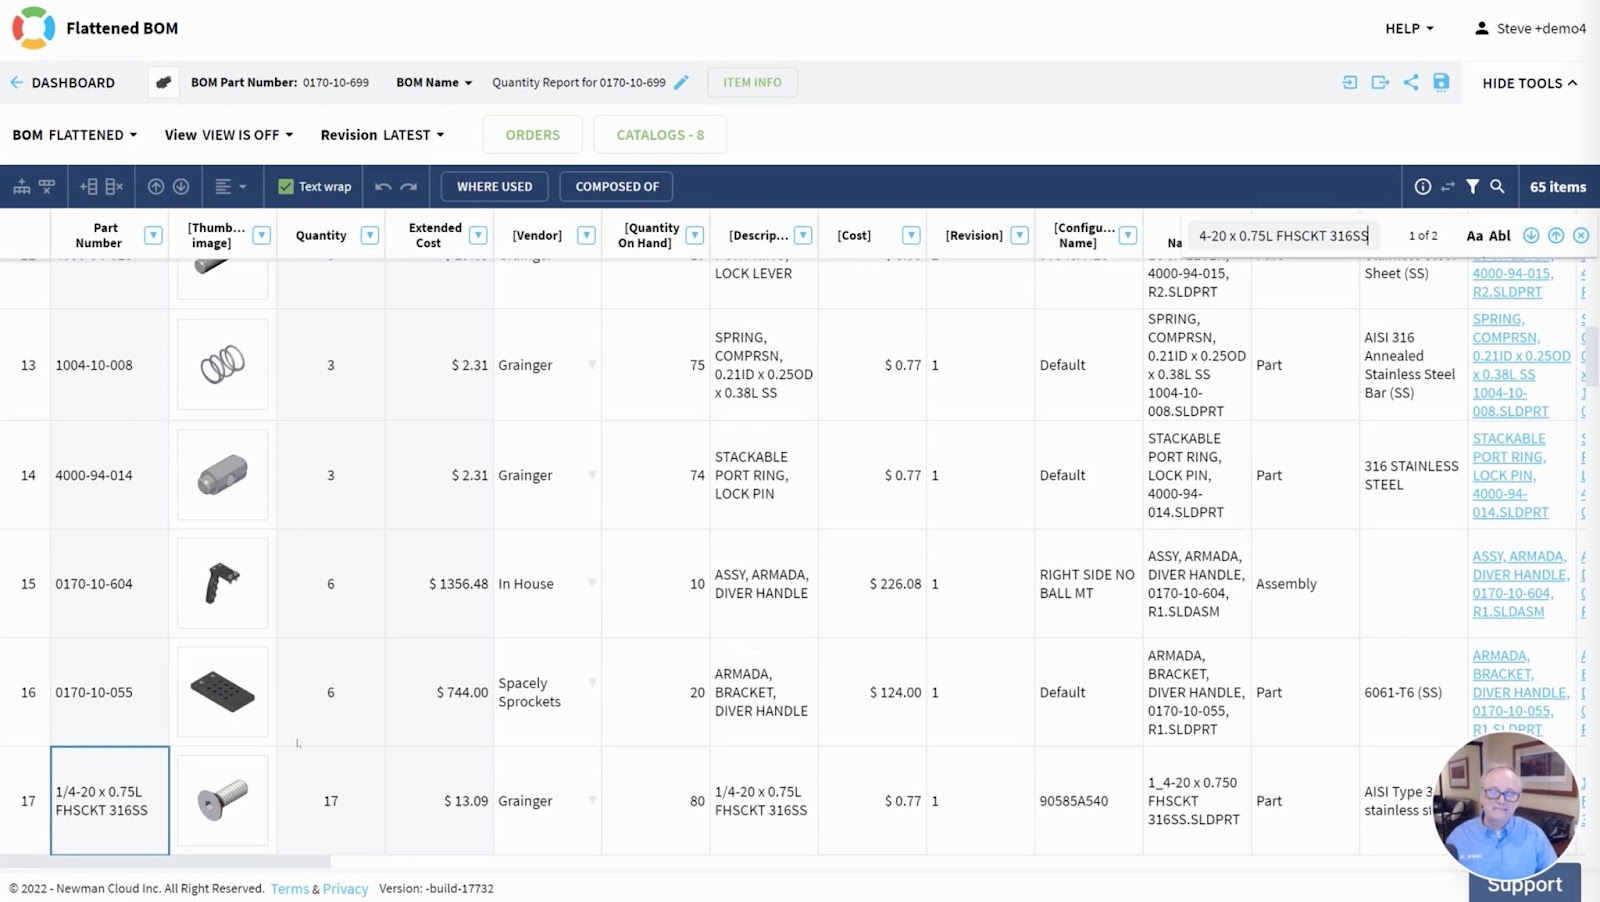
Last, but not least is a flattened visualization type. It is a super powerful tool because it allows gathering information from multiple levels, calculates the totals, and presents it in a flat list. Flattened BOM always calculates things coming in a currently selected assembly and down.
Video 7: BOM Types
In the following video, we describe basic types of BOM visualization in OpenBOM. Check it out.
Other videos from OpenBOM Demo Series
- Video 1: Introduction
- Video 2: Data Model, Catalogs, and BOMs
- Video 3: Item Management
- Video 4: CAD integrations
- Video 5: Importing your data
- Video 6: Formulas and calculations
- Video 7: Types of BOMs
- Video 8: Change Management
- Video 9: Purchasing and Planning
- Video 10: Enterprise Integrations
Conclusion:
We are bringing an introductory video series to help everyone learn about OpenBOM. In this article, we demonstrate basic BOM visualization types – single-level, multi-level and flattened.
OpenBOM’s flexible data model allows one to adapt to any requirements related to a specific set of attributes and accommodate all data one might have. BOM visualization types allow you to visualize the data in the most convenient way. Single-level is easy for editing, multi-level is easy for exploring, and flattened is good for analytics and calculations.
Check out our other videos as well. These 10 videos will give you a great perspective on what OpenBOM can do, its differentiators, and key features.
REGISTER FOR FREE and start a free trial to check how OpenBOM can help you today.
Best, Oleg
Join our newsletter to receive a weekly portion of news, articles, and tips about OpenBOM and our community.